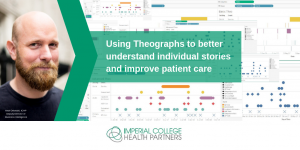
 GPs and commissioners are increasingly interested in using theographs to investigate how patient pathways are working at an individual level. But what are theographs, how do they work and how do I create one? Andi Orlowski, ICHP’s Deputy Director of Business Intelligence, explains.
Theo Georghiou recently published an article A 10-year story: visualising patient journeys explaining how a decade ago he and colleagues at the Nuffield Trust developed a way to visualise patient journeys. These ‘theographs’ (named after Theo) are an extremely powerful tool for both direct care and care planning.
A theograph is a visual representation of the contacts that individual patients have with health and care services over a period of time. They can be used to identify patterns of behaviour and activity, which can in turn reveal where any changes could be made in a patient pathway or care package to improve patient outcomes.
Each theograph includes multiple channels plotted against a timeline, and in the health context these channels represent different touch points within health and social care services – for example a patient visiting their GP, going to A&E, being admitted to hospital, or receiving social care.
They help us put together data provided by multiple organisations that are cooperating to provide a person’s care. Theographs are a seriously powerful tool, but as yet there isn’t a wide understanding about what they can be used for. Different theographs benefit different users in different ways.
Uses for theographs
There is a huge opportunity for the use of theographs in case management. For example, GPs who are engaged in case management of at-risk patients can use them to look at a patient’s behaviours over a period of time and use that knowledge to come up with a new package of care that will improve their outcomes and enjoyment of life.
Commissioners may want to look at the data around patients who have a high level of A&E attendances to see whether they can spot a pattern of activity. There can be a multitude of reasons for patients going to A&E unnecessarily, and often these revolve around them not getting the support they feel they need. Theographs are a great way to visualise this, because using a timeline to show when other interventions occur makes it easy to see what comes first – for example, whether a patient is calling 111 before attending A&E or making multiple A&E attendances before being admitted to hospital.
Theographs can also be used to look at changes in patient behaviour after a new model of care has been introduced such as a new intervention for diabetes patients. On the timeline, the day each individual transferred to the new service is set as ‘day zero’, making it possible to compare activity before and after the change, and see what difference (if any) the new intervention makes to behaviours and how long it takes to take effect.
And of course, we could use theographs to look at care in the future… Can we create predictive or at least indicative plans of care that would be appropriate for the individual? If you see a patient with high activity up to the current date but has no appointments planned for the future could a theograph help trigger better planned care…
How to create and use a Theograph
To create Theographs, you need access to data analysis software such as Tableau (which we use), the right data and an understanding of how NHS data works.
For Theographs to be truly useful in a person’s care, you need to have enough data sources (channels) to make the whole patient journey visible; there is no point in just looking at a subset of it. Thanks to the rise of population health management in today’s integrated care systems and the creation of central data banks, the likelihood is that CCGs will already have the datasets for all their patients across all the channels in their patch – from hospitals, GPs, community services, mental health, social care and so on.
With access to these data banks, all health analysts need to do is align the records on a common key (e.g. patient number), then start to align the data from different locations (the channels on the Theograph). We’ve created a guide showing the step-by-step process to creating a Theograph.
ICHP can also help train CCG teams to create Theographs or we can supply them ready-made and support those working with them to understand how to filter the information so that they only include data relevant to the health condition or pathway of care that’s of interest.
Once the Theograph has been created, GPs or other users can drill into it via a dashboard created by the CCG or another mechanism. Through the dashboard, they can use filters to focus on a particular patient group – such as those with high A&E attendance – and then specify a smaller group to home in on, such as those with diabetes. This will generate a shortlist of perhaps 30-40 patients and the user can then click on one patient and view a theograph outlining their individual patient story.
By drilling down into individual experiences of health and social care, we can learn more about the success of patient pathways, monitor the impact of interventions and ultimately improve patient care.
To find out more about how ICHP can create theographs or offer support with using them email bi@imperialcollegehealthpartners.com


